I’ve spent my own money learning how quickly a good looking metric can hide a bad decision. Now I build the tools that make the real numbers easier to see.
Dian Bilhokista · Ex-founder, builder, still curious.
FIG. 01 / THE DECISION
01 / Lessons paid for
The numbers looked good. The business disagreed.
These are the mistakes I made with my own budget, and the signals I should have read sooner.
FIG. 02 / THE LOOP
Yoofix · Marketplace post-mortem
Acquisition worked. Retention didn’t.
Monthly orders grew more than 560% in three months. Then orders fell 80% when the promo stopped. Almost a third of the business came through WhatsApp, a channel I had treated as support.
Check that the message arrives before judging the message.
OTHER FIELD NOTES
Arture · A campaign ledger connected Meta clicks to signed contracts. The furniture flight cost about 1.4× the average per chat and closed nothing, so budget moved.
Adhi City Sentul · Landing funnels fed the sales CRM. About 1.2% of CRM leads became closed property sales over the campaign period.
02 / The instruments
I build what I wish I had back then.
Not another dashboard to admire. A way to catch the wrong assumption while it is still cheap to change.
FIG. 03 / THE SIGNAL
01
Find the real signal
Small prospect lists built from observed buying signals, with source quotes attached to every claim.
I have been the person staring at a number, hoping it means more than it does.
I founded an AC-service marketplace and ran its go-to-market. I’ve also led engineering and technology teams in logistics, property, and investment. That mix changed how I work: start with the decision, trace the data, then write the smallest useful system.
These days I work directly with founders and teams. I still write code. I still ask awkward questions about the spreadsheet.
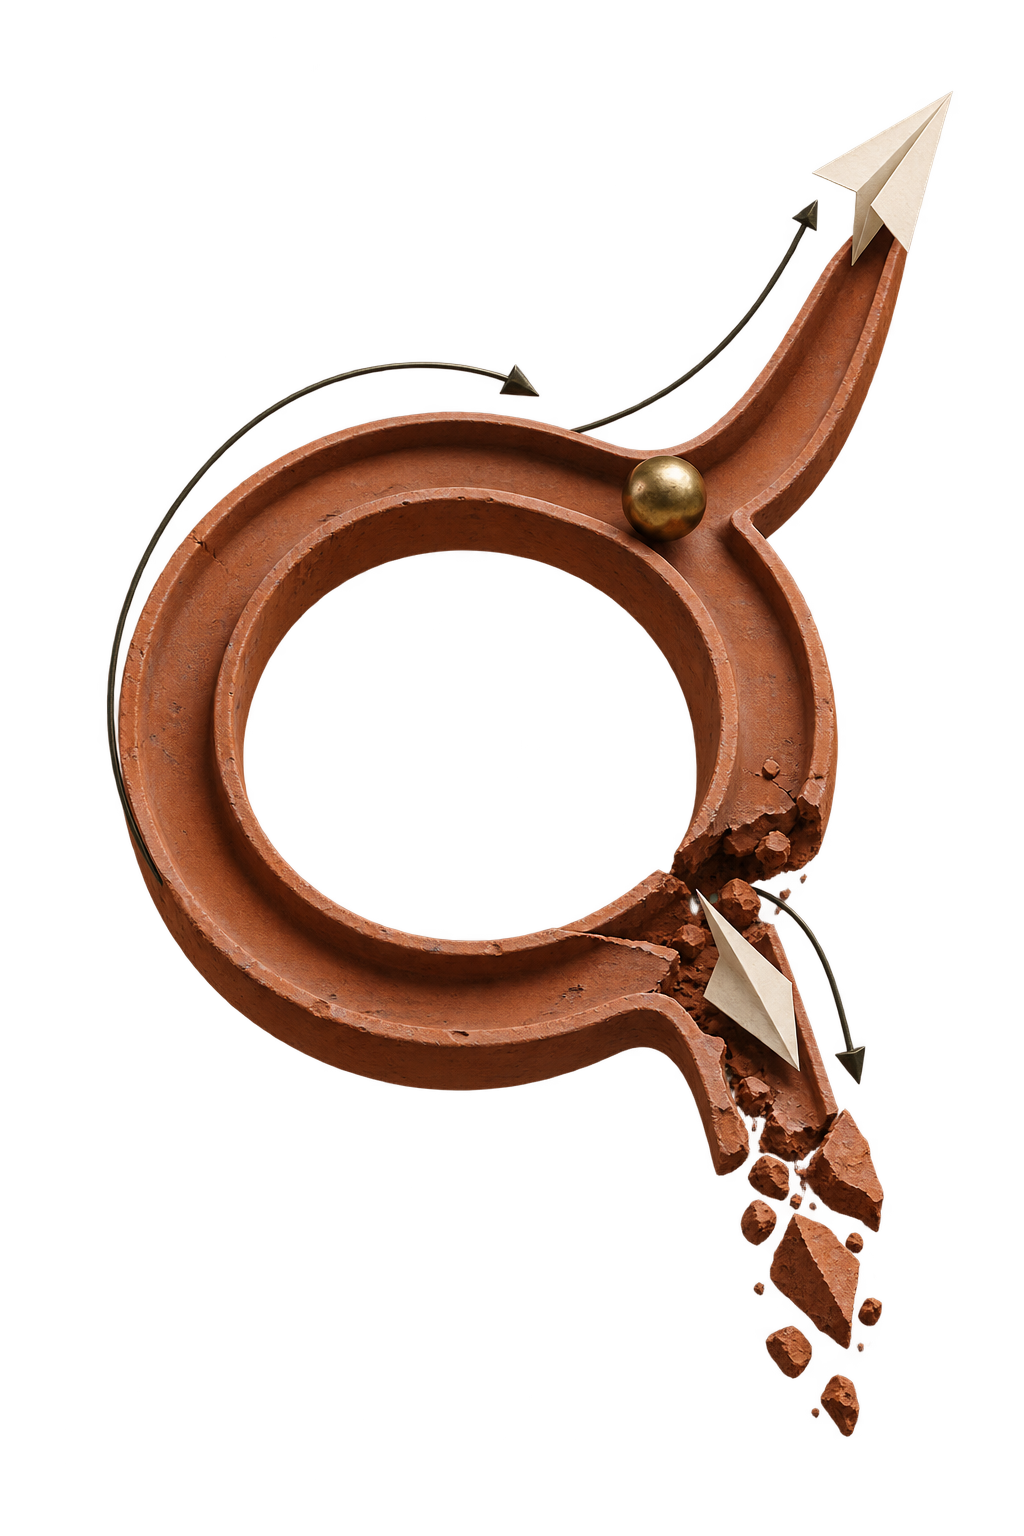
 FIG. 02 / THE LOOP